

Notifications and monitoring
A backup job that fails silently is worse than no backup job, because you believe you are protected. This page covers the two things that stop that: notifications, and metrics.
The default is not good enough
Section titled “The default is not good enough”Out of the box, Datacenter → Notifications contains two built-in entries:
| Name | What it does |
|---|---|
mail-to-root |
Sends mail to the root account’s address, using the node’s own mail transport |
default-matcher |
Routes every notification to mail-to-root |
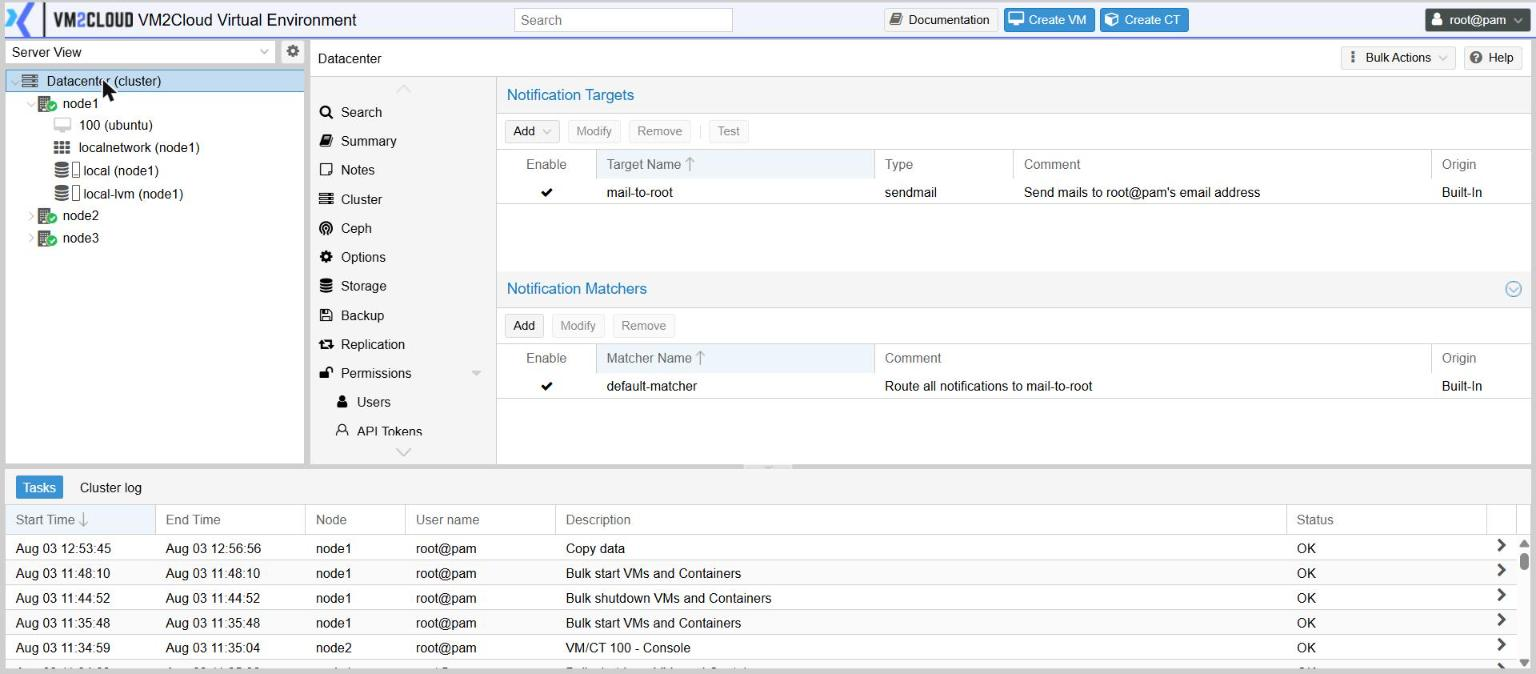
On most networks that mail never arrives — nothing is configured to accept it, and Datacenter → Options → Email from address still holds a placeholder sender that mail relays reject.
Setting up a notification target
Section titled “Setting up a notification target”- Open Datacenter → Notifications.
- Click Add and choose the target type:
| Type | Use it when |
|---|---|
| SMTP | You have a mail server to send through. The right choice for most sites. |
| Sendmail | The node’s own mail transport is already configured and working. |
| Webhook | You want alerts in a chat or on-call system. |
| Gotify | You use a Gotify push server. |
- Fill in the details — for SMTP that means the server, port, credentials and a sender address your mail system will accept.
- Give it a clear Target Name and click Add.
- Select it and click Test.
If the test does not arrive, fix that before doing anything else.
Deciding what goes where
Section titled “Deciding what goes where”A matcher decides which notifications reach which target — by severity, by type, by node. The built-in matcher sends everything to the built-in target.
A common arrangement:
| Matcher | Sends | To |
|---|---|---|
| Failures | Errors and warnings | On-call, via webhook |
| Everything | All notifications | A team mailbox, via SMTP |
That way a failed backup interrupts someone while routine successes stay out of the way.
Notifications from backup jobs
Section titled “Notifications from backup jobs”A backup job has its own Notifications tab, with Recipients and a When setting deciding whether mail is sent always or only on failure. Those notifications are delivered through the targets configured here.
Metrics and long-term history
Section titled “Metrics and long-term history”Every Summary panel has graphs, but they keep a limited window. For longer history, dashboards, or alerting on trends, send metrics to an external system.
- Open Datacenter → Metric Server.
- Click Add and choose Graphite, InfluxDB or OpenTelemetry.
- Enter the server address and port, and any credentials it requires.
- Give it a name and click Add.
Node and machine metrics are then pushed there continuously.
What to watch
Section titled “What to watch”| Signal | Where |
|---|---|
| Failed tasks | Task panel → Tasks, and node → Task History |
| Machines with no backup job | Datacenter → Backup → Show: Guests Without Backup Job |
| Storage filling up | Datacenter → Search, or the storage’s Summary |
| Thin pool metadata | node → Disks → LVM-Thin |
| Disk wear and health | node → Disks |
| Cluster and quorum state | Datacenter → Summary, Datacenter → HA |
| Replication falling behind | node → Replication, Last Sync column |
| Licence expiry | node → Subscription |
If something goes wrong
Section titled “If something goes wrong”| What you see | What to do |
|---|---|
| Test notifications do not arrive | Check the sender address under Datacenter → Options, and that your mail system accepts mail from this server. |
| Some notifications arrive, others do not | A matcher is filtering them. Check its conditions. |
| Backup failures are not reported | The job’s When setting, or no working target at all. Test the target first. |
| Metrics do not appear in the external system | Confirm the address and port, and that the node is permitted to reach it — including through the firewall. |
Still stuck? Contact VM2Cloud support.